

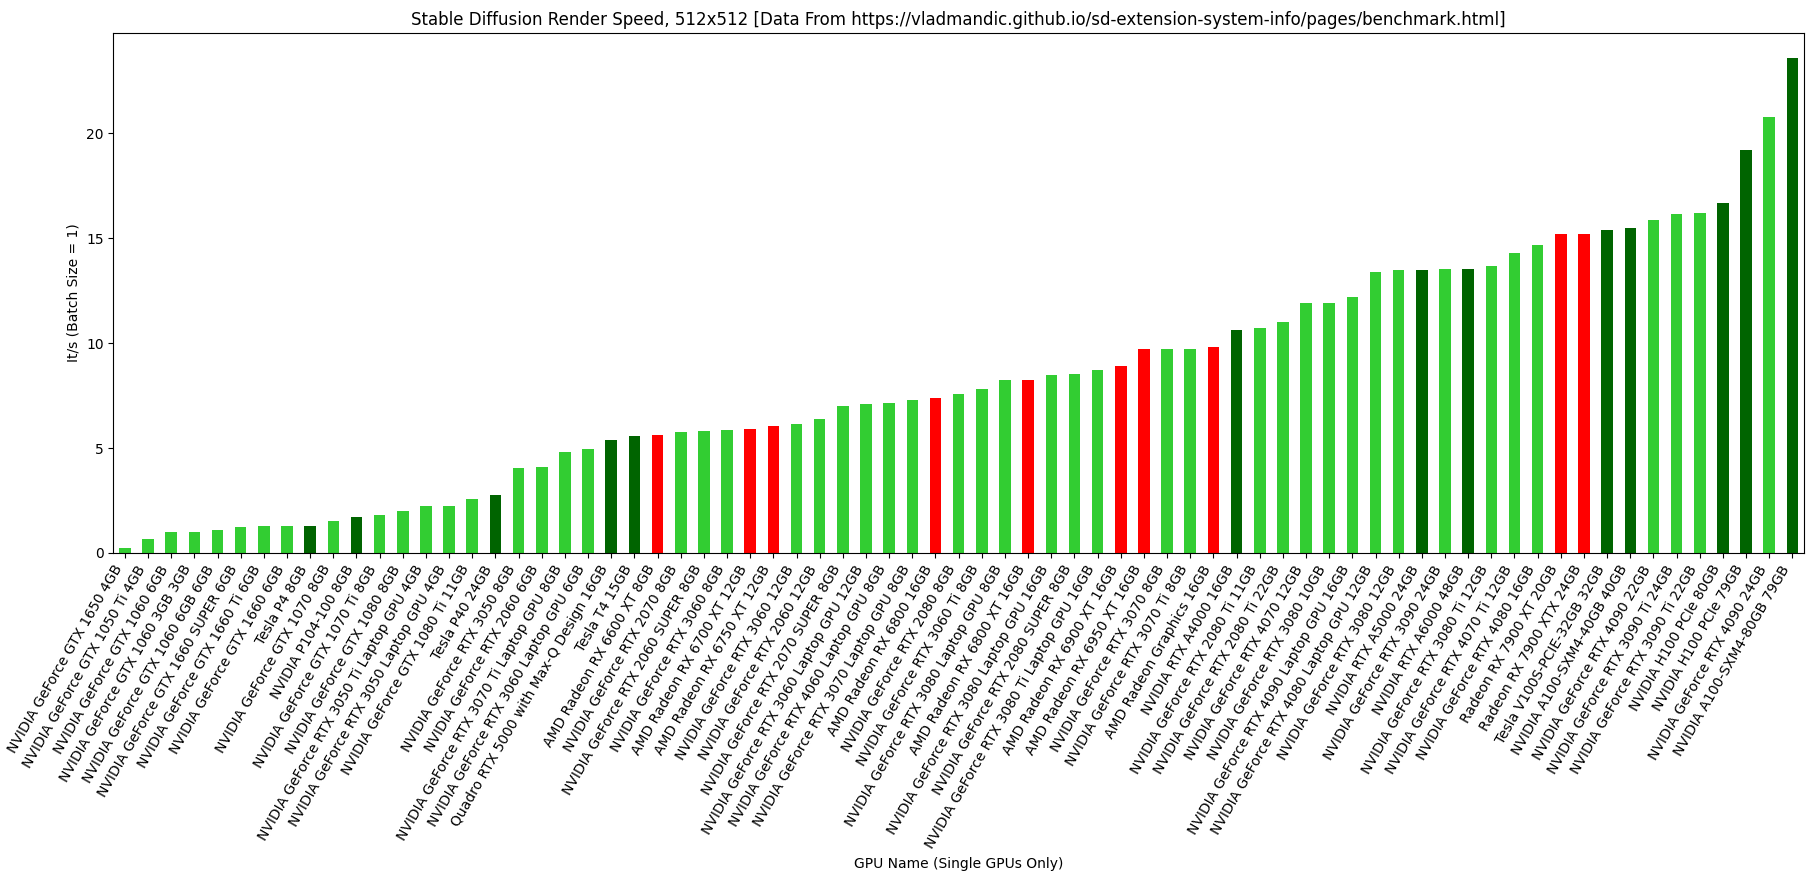
The graphic above summarizes the median 512x512 render speed (batch size 1) for various GPUs. Filtering is for single-GPU systems only, and for GPUs with more than 5 benchmarks only. Data is taken from this database (thank you vladmandic!). Graph is color-coded by manufacturer:
- NVIDIA consumer (lime green)
- NVIDIA workstation (dark green)
- AMD (red)
- Intel (blue), seems there’s not enough data yet
This is an update/prettier visualization from my previous post using today’s data.
Wait a minute, how can a mobile 3060 (12GB one) be faster than the desktop version?
Yeah, the data is definitely not perfect. If I get a chance, I’ll poke around and see if maybe it’s one person throwing off the results. Maybe next time I’ll toss “n=##” or something on top of the bars to show just how many samples exist for each card. I also eventually want to filter by optimization, etc. for the next visualization, though I’m not sure what the best way is to do that except for maybe just doing “best for each card” or something.
So it’s just imperfect sample, I thought mobile 3060 really is faster than the desktop one. Thanks anyway, this graph really helps me choosing GPU.
Yeah, I glanced over it and couldn’t immediately see why the laptop one was benchmarking faster. There were only 7 samples or something for the laptop one, though, so it could just be a fluke. Maybe the laptop folks are using only the best optimization or something. I’ll keep playing with it when I get some spare time.