• 1 Post
  • 3 Comments
Joined 11 months ago
cake
Cake day: February 9th, 2024

help-circle

  • hmmm… about:memory might have the info but I have no idea how to interpret it.

    Adding the !g gives a google results page with 1 relevant result which suggests it might just be an open question. (Thread is from March 2024.)

    I have been using ddg for years and never bothered with bangs. They’ve changed something in the past months/year or so. I think the engine tries to guess too much what you mean. Obviously, there exists many webpages with my search query exactly as I wrote it. But even the google search is mostly finding results “about performance” like the screencap of the ddg is guessing.
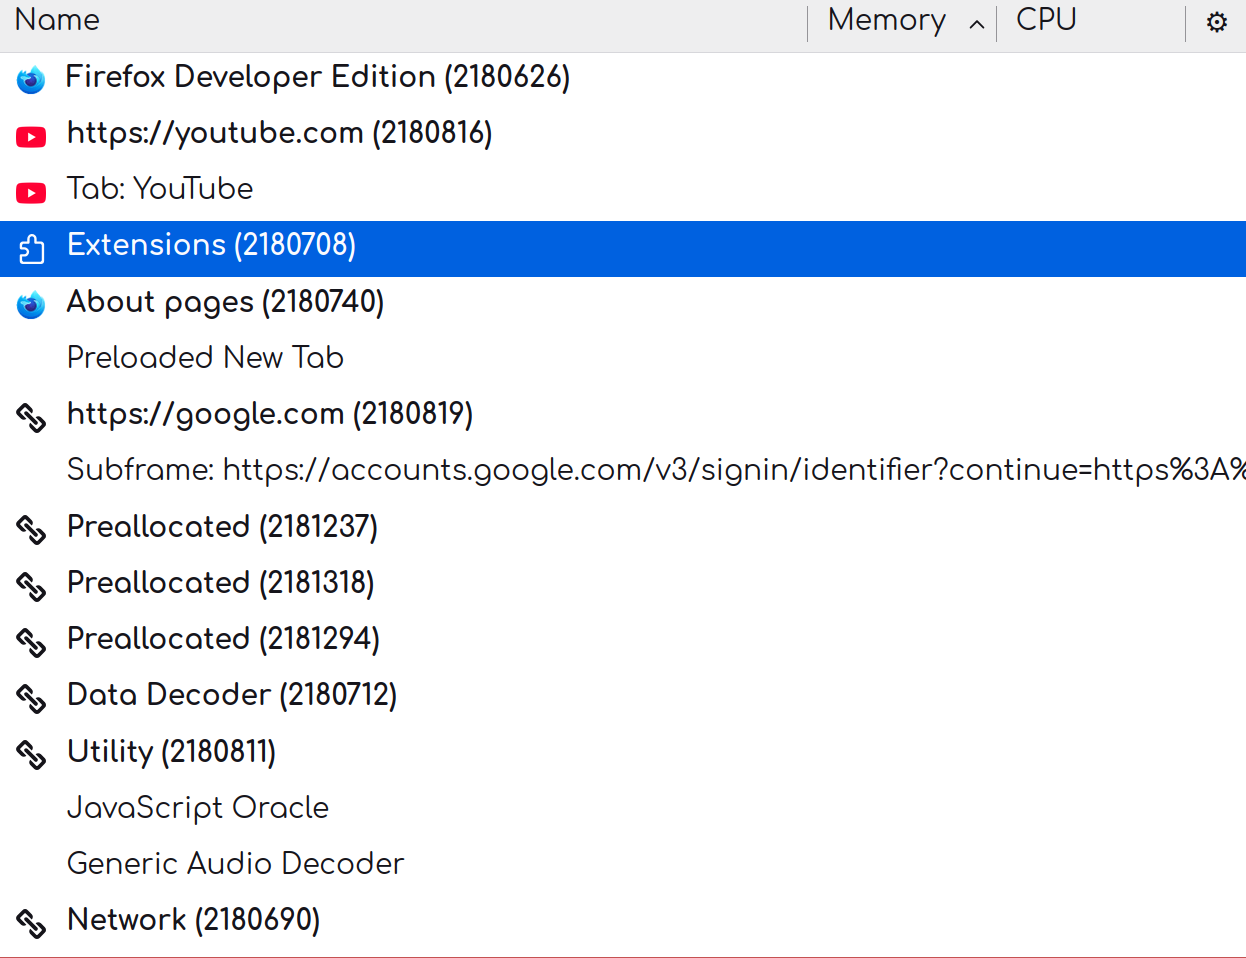

  • Thanks for the suggestion. I don’t understand how to use this though.

    For a moment there actually was info in the Memory and CPU columns but I went to another tab/window and when I returned it is blank again. If I could reproduce that, then I would be able to see resources use of individual pages, but there is nothing about individual extensions here that I can see.

    If you hover the mouse each row, a little speedomoter time icon appears. It has a tooltip reading “Profile all threads of this process for 5 seconds”. Clicking it brings you to a URL beginning https://profiler.firefox.com/from-browser/calltree/ which appears to collect information from the system and send to mozilla (?) without asking consent to do so.

    Here is the content when I clicked the speedometer button on the “Extensions” row above:

    How is this interpreted?

    Tangent: is anyone else finding duckduckgo extremely unhelpful these days? A search for "about:performance" gives zero results. Is this do to having to be so aggressive against AI spam?